The Adaptive Control Decision Support System – Case Study
MIDTOWN MANHATTAN
|
Midtown Manhattan is characterized by a closely spaced signalized Cartesian grid systems of one-way streets, with short blocks (approximately 200 ft.) along the avenues, and long blocks (approximately 500 ft. or longer) along the cross streets. This is a grid network with highly over-saturated traffic and sophisticated traffic patterns. |
|
|
|
STRATEGIES To address this type of sophisticated urban network control, ACDSS employs a hierarchical bi-level control structure. The first phase implementation started on July 11, 2011, covering a core 110 square block zone in the central business district of Midtown Manhattan, from 2nd to 6th Avenues, and from 42nd to 57th Streets, inclusive.
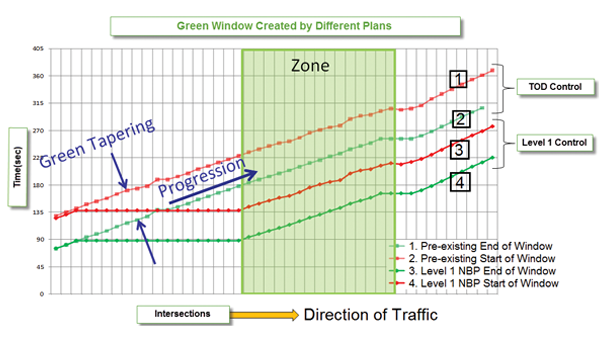
 This figure illustrates two types of patterns as effected by different signal control strategies. From top to bottom, the area between the first red line and the first green line shows traffic signals are coordinated to facilitate the traffic progression along the arterial direction. The area between the second red line and the second green line shows a gating pattern where traffic signals employ simultaneous offsets outside the control zone. The gating pattern regulates the incoming traffic to maximize urban road capacity utilization and re-balance arterial and cross street traffic before delivering the incoming traffic to the core control zone. |
|

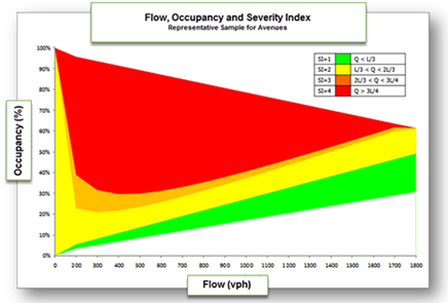
The top picture: the flow-occupancy zones and the corresponding Severity Index levels. Red and green colors represent the most severe, and the least severe queuing conditions, respectively. The bottom picture: queue sizes are estimate from the flow and occupancy measurements, then the estimated queue sizes are mapped to 4 different levels of Severity Index. DETECTION In the first phase of the deployment, 23 E-ZPass readers (note: ~80% of the vehicles in the control area have tags), 100 microwave sensors and 25 IP cameras were used. E-ZPass readers provide real time, per-trip travel times and microwave sensors provide volume and occupancy data. This data is supplied to ACDSS to support strategic Level 1 control decisions and Level 2 adaptive signal adjustments. IP cameras allow the operators at the TMC review and verify strategic Level 1 control plans before field implementation. |

 |
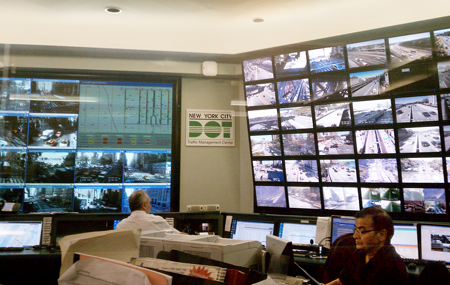
CONTROLLERS Peek ASTC-CBD 3000 controllers are deployed at each intersection. All communications use standard NCTIP protocols over a wireless network. No proprietary MIBs are employed. OPERATOR-IN-LOOP ACDSS supports both autonomous and operator-in-loop mode. In Midtown Manhattan deployment, operator-in-loop is enabled for Level 1 control, so that operators at the Traffic Management Center can review, verify and implement the recommended Level 1 control plan in real-time (Figure 3). AUTONOMOUS OPERATION ACDSS in fully autonomous mode runs as system service and supports 7/24 operations. The adaptive control system can also be activated based on schedules. In Midtown Manhattan deployment, Level 2 control runs fully autonomous on a 7/24 basis, dynamically changing signal timings to perform queue management at over-saturated intersections. BENEFITS ACDSS has resulted in a noticeable 10% improvement in speeds in this highly over-saturated control area. This has been verified by the before-and-after ETC travel time data and independent taxi GPS data. It has also been reported and observed that queues are better managed with less local congestion. Higher percentage of low Severity Index pairs, i.e., lower average SIs for both cross street and avenues have been verified from the before and after data. The agency decided to maintain the 10% speed improvement so as not to impact pedestrian and bicycle movements. A critical element of this ACDSS deployment is the capability to provide prompt alert and dynamic congestion diagnostics about the trouble “spots”, and suggest real time strategies to the control room operators. For effective control of a congested traffic network, this “operator-in-the-loop” mode is viewed highly important to help achieve reliable and robust operations. |
This figure below shows the real-time alert dialog to the operator. For arterials under Level 1 Strategic Control, ACDSS recommends appropriate control strategies. The operator can review, validate and verify the recommendations before accepting or rejecting them. The back GUI shows the real-time traffic situation of the control area.

