The Adaptive Control Decision Support System – Case Study
VICTORY BOULEVARD
|
Victory Boulevard is a major thoroughfare on Staten Island, measuring approximately 8.0 miles from the west to the upper east shore.The traffic flow is characterized by east-west bound heavy commuting traffic in addition to the significant traffic entering and exiting the College campus. |
The Victory Boulevard deployment features sparse detectorization and an signal optimization operation capable of dynamically adjusting cycle, offset, and splits in real-time to prevailing traffic conditions.
|
|
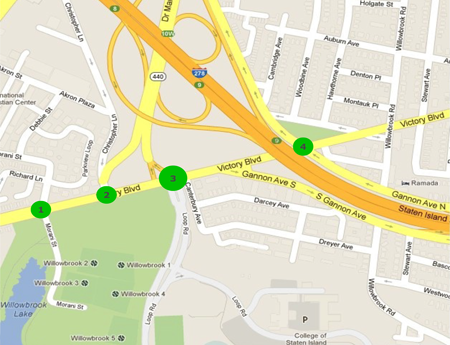
 This figure shows a 4-intersection deployment at Victory Boulevard. The College Entrance/Victory Boulevard intersection (circle # 3) is the critical intersection, with traffic flow varies daily due to class schedules. The Christopher Lane intersection (circle #2) is where the arterial joins the freeway. |
DETECTION 5 RTMS microwave sensors are strategically deployed to provide mid-block flow and occupancy data for a total of 19 detection zones; the data is aggregated at 30 second intervals. Non-critical turning movements are interpolated by an advanced real-time data estimation algorithm. The whole site, if fully instrumented with detectors would require 67 detection zones. Thus this minimal/sparse detectorization provides the necessary data inputs to the system while effectively minimizing the ongoing operation and maintenance costs for detection equipment. Figure 2 shows the detection layout at this site. 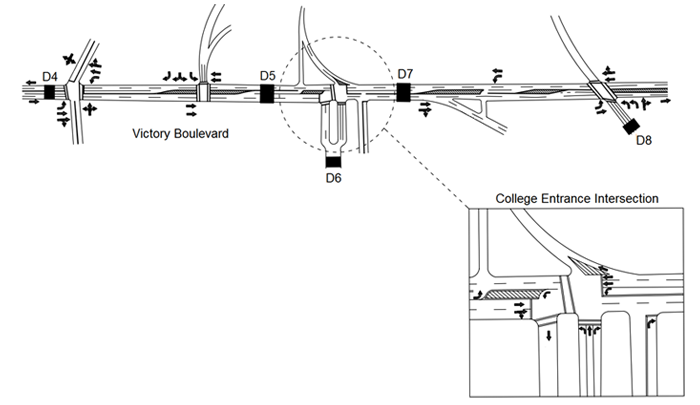 This figure shows the schematic of 5 RTMS detection units deployed at mid-block locations. These units are marked as D4 to D8. The arrows represent all turning movements relevant to the adaptive control. At locations where there are no detection units, turning movement volumes are dynamically estimated based on the data from other detection units. THE SIGNAL OPTIMIZATION Adaptive signal plans are implemented by the Peek ASTC-CBD 3000 controllers at the intersections. ACDSS communicates with the field controllers through TransSuite TCS/Web Service Interface. The latter talks to the controllers through the standard NTCIP. No proprietary MIBs are required. Data objects of standard NTCIP MIB are used to dynamically change the cycle, offset and splits based on prevailing traffic conditions. Figure 4 (see over) shows the splits’ variations in response to the real-time data. |
|
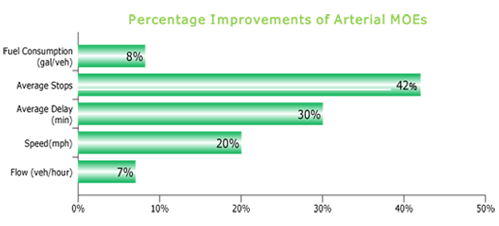 |
BENEFITS ACDSS has demonstrated significant improvements in arterial
performance. These include 8% fuel consumption saving, 42%
reduction in average stops, 30% reduction in average delay,
20% improvement in speeds and 7% improvement of throughput.
|
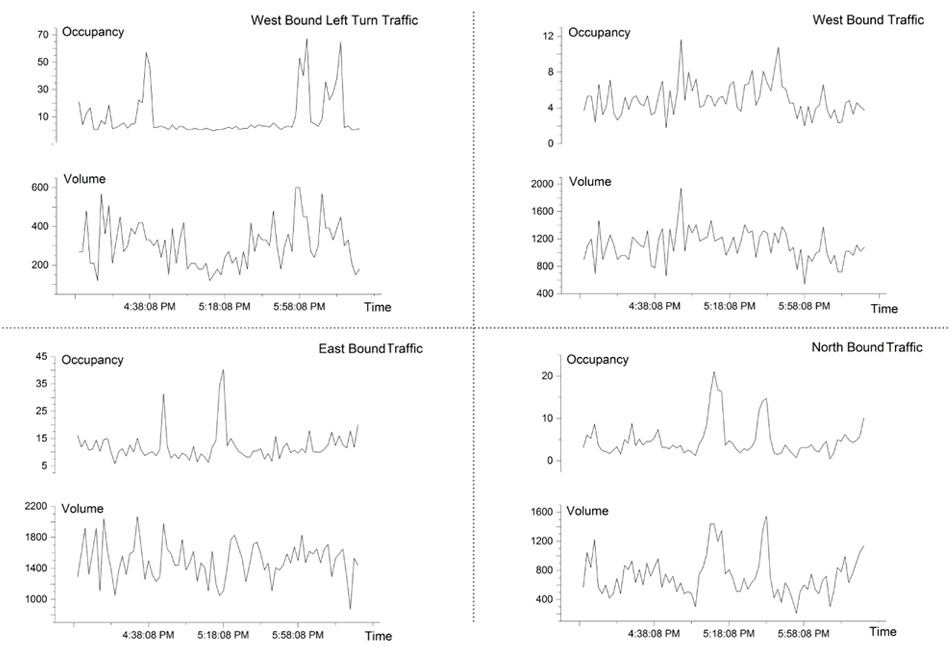
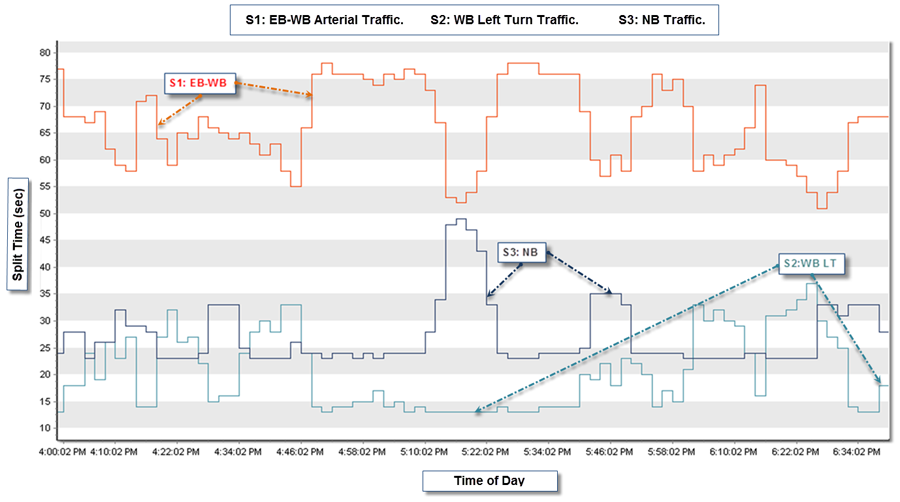
The upper panel shows the EB, WB, WB left turn, and NB traffic volume and occupancy data. The lower panel shows the resulted splits during typical PM peak hours. The WB left turn traffic entering the College campus is heavily influenced by the class schedule and varies daily. During peak hours, the spill-backs from the WB left turn traffic significantly impact the adjacent lanes further exacerbating the EB and WB traffic conditions. By changing signal timing in real-time, ACDSS significantly improves the traffic at the critical intersection while resulting in reduced of number of stops, improved travel speeds and throughput of the overall arterial system..